2013/04/09

Project311- Visualization of the Evacuation Process During the Tsunami

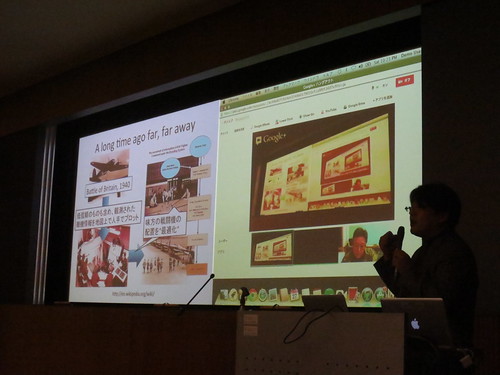
"Visualization of the Evacuation Process During the Tsunami" project by "Team Masters & Forever 22" started from a simple question- Why were evacuation during the tsunami so slow? In order to get hints to save lives in future disasters, they analyzed how people moved fleeing from tsunami in the coastal areas.

Video (Japanese audio, English subtitled)


Slides:


They used ZENRIN Datacom's data to see the changes in population density per 250m2 and visualized them on Google Maps, in conjunction with shelter data and water level data.

They picked the town of Otsuchi in Iwate Prefecture as a model case for 4 reasons:
1) center of the town is all gone due to tsunami
2) lost 10% of the population due to tsunami
3) was surrounded by mountain, and should have been able to evacuate
4) the researcher had 3 relative families there, and one is still missing due to tsunami, so she has talked with the citizens and knows the actual situation there before and after the tsunami.

(I think knowing the reality is very important when analyzing the data. Not just looking at the data only, but going back and forth between data and the real world is very important in analyzing data.)

This is the map of Otsuchi, red line shows where the tsunami came. The area circled with yellow line is the area that are the busy area during the daytime, with municipal buildings, hospitals etc, and note these are all built alongside the river. The team mapped hourly population density change and created video out of those data.


The earthquake happened at 2:46 p.m. The Meteorological Agency issued an urgent report that the tsunami is estimated at 3m in Iwate. The levees in Otsuchi are 6.4m tall, so many people figured that they wouldn't have to evacuate, and there even were people who took cameras to the top of the levees to watch the ocean.


30 minutes after the quake, the Meteorological Agency issued its first correction of the initial estimate of tsunami size, but at this point the first wave of tsunami had already reached the town. At Otsuchi, in merely 30 minutes, the waves surmounted the levees and entered the town, influencing citizens' destiny.

This picture is from around 4 p.m. Most people have already evacuated from the coast.


Since Otsuchi is a small town, it may seem that everyone should be able to reach higher and safer places within 10 minutes. However, as you can see from this data- which is the route an actual tsunami victim took to evacuate, movement of people are much more complicated.


She says it would be useful for preventing similar disaster in the future, if we could get a more detailed data of the movements of people in these decisive 30 minutes.

After the tsunami's arrival people do not move much, but can see a slow decrease of people. Since Zenrin's data is based on the GPS information of cell phones, and there were power outages in the town, it is likely that cell phones ran out of battery and lost their GPS connection.

Also, there are issues about the data.

The image on left shows population distribution from 2 to 3 a.m. on the day after the quake, and on the right, from 3 to 4 a.m.


Zenrin's data had 190 people in several places in the image on the left, and those people disappeared in the image on the right. Also, we see numbers like 92. This number probably comes from the calculation of 29 minute long access, by multiplying 29/60 by 190.... representing the proportion of people with reception over time. In larger cities, those calculations might be effective, but in smaller towns like Otsuchi, we should use raw data to get accurate movement of people.

However, we are able to learn two important things from this data.

1) Up until 12 hours after the tsunami, we had multiple cell phone signals even from flooded area
2) We can track individual cell phones, on how many hours and minutes they lasted

So we can propose several useful ways of using cell phones during disaster from this data.

Proposal 1) Create power-saving mode for cell phones
If users set their cell phones to power-saving mode, it can make the battery last up to 3 days. This mode should stop unnecessary functions and applications, and allows only GPS, mail, and phone calls to operate. Also, slow down the GPS transmissions to about once in 5 minutes. Cell phones lose battery power much quicker when reception is bad. But even when there is no reception at all, like during the disaster, we can still trace the owner's whereabouts for 3 days with the GPS. If we could relay personal 
information like that to firefighters or the Self-Defense Force or relatives, it would help the search effort.

Proposal 2) Create cell phone relay stations that can be transported by helicopter
This would enable us to send evacuation and rescue information via e-mail to people in need.

Proposal 3) Make an exception to Privacy protection law during disaster
In order to make those work, we would have to have exception to privacy protection law to rescue disaster victims.

Comment from Professor Murai:

The thing about 30 minutes is interesting. The standard life for cell phone relay station batteries is 30 minutes, too, so there might be connection. They will be changing the battery life of relay stations to 24 hours, so that might affect it.
Comment from Suzuki-san:

Un reality, the cell phone batteries held up. But even in cases where there were generators and cell phone batteries available, sometimes the relay station had been swept away or the power of relay stations went down. Supposedly the cell phone relay station batteries lasted for about 24 hours. After that, probably also due to congestion, communication became impossible. Cell phone's power saving more is important, but ways to prolong relay stations are even more important.

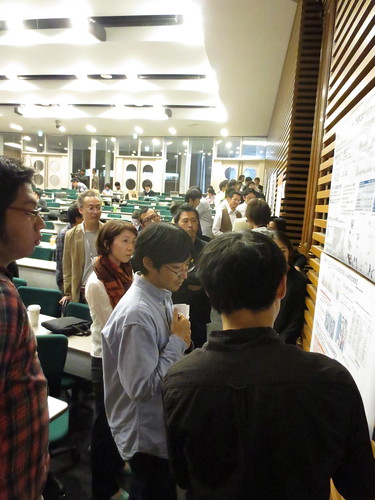
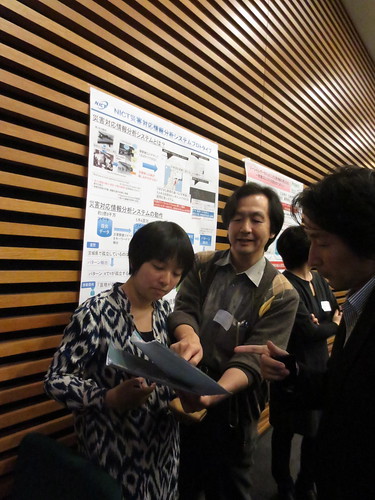
This team also presented at the poster session with their analysis of tendency of roads that tends to get traffic congestion and roads that tends to isolate victims by natural disaster.


Disclaimer: The opinions expressed here are my own, and do not reflect those of my employer. -Fumi Yamazaki

2013/03/18

Videos to experience Japan

I'd like to introduce several awesome videos about Japan.

Keio Global | Shaping History, Shaping Tomorrow


"Follow one international student's breathtaking journey through the heart of Tokyo and experience the sights and sounds of Keio University. Our student navigates both ancient and advanced, sipping tea in centuries-old ceremony one moment and break-dancing alongside Keio students to Japanese hip hop the next. After perfecting controlled brushstrokes at the Japanese calligraphy club, he tackles a jostling bout of sumo with students and joins experiments in state-of-the-art robotics research at a Keio laboratory. With its rich history and modern outlook, Keio University offers a rewarding and exciting lifestyle to international students while providing a first-class education over an extensive range of disciplines, including a number of programs taught entirely in English."
You can read the production interviews here.

Hayaku: A Time Lapse Journey Through Japan


Hayaku: A Time Lapse Journey Through Japan from Brad Kremer on Vimeo.

"To all those affected by the earthquake and tsunami. You are in our thoughts and prayers. We wish for the safety of you all. Japan is one of the most beautiful countries in the world. This is my Japan. This is one of the many reasons why I love Japan. I shot this in many locations around Japan in the summer of 2009. Some of the location include Tokyo, Matsuyama, Imabari, Nagano, Gifu, and Ishizushisan."
Series of videos by augment5.

Kusatsu

Kusatsu Oct 26 , 2011 from augment5 Inc. on Vimeo.


Kyoto

KYOTO Nov 4-5 , 2011 from augment5 Inc. on Vimeo.


Mino

Mino Aug 1,2012 from augment5 Inc. on Vimeo.


Enoshima

ENOSHIMA Oct 16 , 2011 from augment5 Inc. on Vimeo.

Disclaimer: The opinions expressed here are my own, and do not reflect those of my employer. -Fumi Yamazaki

2013/02/24

"Wake up Japan!" says Dave McLure

Global Innovation Conference was held in Osaka which I didn't go, but I thought I'd share its keynote video.

The speaker was Dave McLure, and he told the Japanese people to wake up, it's no longer the time for the Japanese to be sitting in the comfort zone, because this country is on fire. He tells people to become the nail that sticks out, move fast and break things, and don't be afraid to fail, because key factor to innovation is creativity, failure and iteration.

There is a famous saying in Japanese "七転び八起き" which means even if you fall 7 times, get up 8 times and move forward. But at the same time, the Japanese wants to do things well and organized, the citizens does not like failure, it's a country that fears shame.

"Failure is necessary, it is a process, not a problem." says Dave, and urges Osaka's mayor Hashimoto to dance without practicing, show everyone his failure in public, and urge the citizens to make failures- make them feel they are allowed to fail, practice, and become successful taking that failure as a process.


Disclaimer: The opinions expressed here are my own, and do not reflect those of my employer. -Fumi Yamazaki

2013/02/18

Project311- Project Hayano

Project Hayano is a project to understand the risk of the children in Fukushima and surrounding areas to get thyroid cancer due to internal contamination of Iodine 131. The team mashed up simulation of Iodine plume emission from the nuclear power plant with traffic congestion map which shows where people actually were.

The purpose of this project, at the end of the day, is to work on a legislation so that when someone gets thyroid cancer in the future, the government will need to compensate the medical fee without the citizens to prove the causal relationship between the cancer and the nuclear power plant accident. Calculations done during Project311 will be used for the financial estimations related to that bill.

Slides used at the presentation is as following:


You can see Professor Hayano's presentation video here, audio is in Japanese, you can turn on English subtitle, and machine translation on other languages:


He started this project because many people feared the internal contamination of radiation due to the
Fukushima nuclear reactor accident. He proposed to do tests of school lunches and other meals, and
combined those with measurements from whole body counters (WBC). From those data, he learned that the internal contamination due to radioactive cesium in contaminated foods was extremely low. For example, the following diagram shows the results of whole body counter scans since April 1st within Fukushima Prefecture. 99.1% of scans were below the detection threshold. And for children, 100% of the scans were below the detection threshold.


According to data from 1964, Japanese person's body had about 10 becquerel of cesium per kilogram of body weight.


If we compare this to the data from Fukushima, we can see that most people in the prefecture are far below the level of data back in 1964.


However, that doesn't mean that everything is OK. Iodine 131 has a half-life of only 8 days, and there could have been many who inhaled it shortly after the accident. Data from that period of time barely exists, so many people are anxious about this. It is known that after Chernobyl accident, many children
developed thyroid cancer from the iodine intake. So we need to know what the risk of developing
thyroid cancer is for the children in Fukushima and the surrounding prefectures.

Professor Hayano started "Project Hayano" aiming to evaluate openly the risk of internal contamination by radioactive iodine. In order to do so, he had to know how many people inhaled how much iodine at what time at each location. We have to rely on simulations such as SPEEDI etc to guess the amount of iodine (since real data does not exist). The problem until now was to estimate when and how many people were present at each location. Thanks to the congestion data provided by ZENRIN DataCom at this workshop, they were able to solve that problem.

Risk evaluations are made by multiplying radiation dose times the number of people. For example, if 1 person had a thyroid radiation dose of 100 millisieverts, the risk would equal that for 10 people with 10 millisieverts each. This is the hypothesis they used.

Of course, the federal and local governments have also done population behavior studies, asking where the people were on paper surveys, and their survey results were used for evaluation of radiation doses. However, because this is private information, the data will not be open to public and third-party evaluation is impossible. Therefore, they used the data provided by ZENRIN DataCom and SPEEDI to conduct a risk evaluation that is verifiable by third-parties.


There are many kinds of simulations, he used 4 of them.

1) Data from SPEEDI, which is open to public, movie with timeline
2) Data compiled by JAMSTEC and mashup movie with ZENRIN data
3) Data calculated by the National Institute for Environmental Studies and mashup movie with ZENRIN data, and another mashup movie with ZENRIN data (iodine * people)
4) The JAEA calculations.

Professor Watanabe made a mashup map on Google Earth and overlaid the data with the congestion data from ZENRIN DataCom. For example, in the screenshot below, the green bars and circles underneath is data from ZENRIN, showing where people were at about 3 p.m. on March 15 -and you can move the sliders to change the time frame. The red bars represent the concentrations of iodine in the atmosphere close to the surface.


You can see the simulation here on the web: http://speedi.mapping.jp/
-Time slider at top left will enable you to move the timeline
-Navigation tool on the top right will enable you to zoom in/out on specific place
-You can toggle on/off the following using the checkbox on the menu bar
  1) Iodine simulation by National Institute for Environmental Studies (NIES, default on)- red bars
  2) Iodine simulation by Japan Agency for Marine-Earth Science and Technology (JAMSTEC, default on)- color coded on the surface
  3) Iodine simulation by Japan Atomic Energy Agency (JAEA, default off) - color coded on the surface
  4) Iodine simulation from System for Prediction of Environmental Emergency Dose Information (SPEEDI, default off)- orange bars
  5) Traffic congestion data by ZENRIN DataCom (default on) - green dots, for places with more than 500 people 3D bar chart is displayed
  6) Automobile drive map by HONDA (default off)
  7) Phone service map (default off)- red represents areas where mobile phones were down, grey represents areas where fixed phone lines were down

Before we move on, we need to understand how reliable the basic data we are using is.

1) Understanding ZENRIN's data


Prof. Hayano plotted how many people were within radius of 5 kilometer intervals from the reactor along with the time. From the chart, on 3/10-12, we can see people actively entering and leaving the 5-kilometer zone, going to and from work, before and during the accident .

On 3/12-14 we can see fewer and fewer people within 5, 10, and 20 kilometers, due to the evacuation order with people fleeing from the reactor, and the population is decreasing. On 3/13-14 it looks like the population is decreasing, but this was due to the cell phone base stations going down, so we don't have accurate data during this time.

However between March 14th and 15the the base stations started working again and it looks like the number of people is increasing. The most problematic time of the reactors were from the early morning of March 15th to March 16th, when the concentration of iodine was at its highest. Fortunately the ZENRIN data for this time is from after the base stations restarted, so it appears to be useable.

Further investigation on ZENRIN's data: this population frequency distribution chart shows how many people were within this 250-meter grid, and we see peaks at 200, 400, 600, and 800.


What we can guess about this data is that here were certain number of people with automatic GPS features on their phones within the grid (like 1, 2, 3 people) , and we can see that ZENRIN is multiplying them by the proportion of contracted cell phone users, and guessing that there are 200, 400, or 600 people there. Then, the intervals are filled in.

Taking a closer look at the data for March 10, 3 p.m., as an example- people aren't moving much, and the peaks are sharp. But at 8 p.m., when people start changing locations the peaks become flatter. So we can imagine that the data has been derived using the fractions of people leaving and entering the grid. Due to this reason, prof. Hayano didn't use the 250-meter grid, instead made the space-time grid coarser.


2) Understanding SPEEDI's data


Here, Professor Hayano evaluated 2 kinds of SPEEDI calculations (in red and blue), and overlaid them with the calculations from the National Institute for Environmental Studies (in yellow) to check the difference. Unfortunately, the data is extremely different. The source terms must have been pretty different. Therefore, they made the grid coarser here as well.

He published the population figures for a 10-kilometer grid openly, and asked many people to help check the calculations. As a result he was able to approximate the magnitude.


The purpose of this project, at the end of the day, is to work on a legislation so that when someone gets thyroid cancer in the future, the government will need to compensate the medical fee without the citizens to prove the causal relationship between the cancer and the nuclear power plant accident. Calculations done during Project3111 will be used for the financial estimations related to that bill.


Q (Professor Murai): What do you think the relationship between these data presented today should be - data published and analyzed by the authorities, and data that is publicly available and can be analyzed by anyone?

A: That is a difficult issue. Ever since March 11th, there were many questions surrounding the way authorities that are supposedly owning data- how they communicate or publish data, how those data are utilized or not utilized. It is important that our project published the data openly in a way anyone can see what was happening and verify.

Project Hayano's documentation can be seen here [ja]:

You can see how cautious Professor Hayano is about the data itself. Getting reliable data is extremely important in analyzing data, because if the data is rubbish all of the analysis will be rubbish as well. Therefore, he takes a lot of efforts verifying the data, making the data available and asking many people to check and verify his calculations.

The other important aspect about this project is that it is goal oriented- Prof. Hayano has the aim to make a legislature to save the victims get compensated if they get cancer in the future, and he is very focused on making that happen. Data, research and analysis is tools for making bigger decisions, not the goal.

He was also very successful in involving other people help his project- many experts provided data outside Project311 itself, due to his credibility. He was also able to get many people to help verify his calculations.

We learned so much from professor Hayano through watching his projects.

He continues working on his projects, and the latest presentation slides can be seen as below, it is a comparison of thyroid radiation intake between Chernobyl and Fukushima.


It looks like Fukushima (red) is extremely lower than Chernobyl (blue) and the distribution differs greatly as well.


BTW, Project Hayano was actually the very first project that launched at Project311. Upon launching Project311, we weren't sure how many people would participate. We didn't know how many valuable projects will start from our data. On 9/19, we did an event called "office hour". We gathered participants and all of the data providers in our office, and made this opportunity for the participants to ask questions to the data providers. At the after party of this office hour, Professor Hayano started talking about what he wants to accomplish from this project- which was so concrete and so compelling. The moment I thought there definitely will be great findings coming out of the workshop was when I talked with Professor Hayano. Thanks again!

Disclaimer: The opinions expressed here are my own, and do not reflect those of my employer. -Fumi Yamazaki

2013/02/17

Project311- Comments from Professor Murai

One of the commentators for Project311 workshop was professor Jun Murai from Keio University, Dean of the Faculty of Environment and Information Studies.

He is called the "father of Japan's Internet", the founder of JUNET and president of WIDE Project. He also served in the past as the president (currently board of trustees member) of Japan Network Information Center (JPNIC), Advisory Member of Information Security Policy Council, Cabinet Secretariat Information Security Center, Cabinet Secretariat of Japan and Advisory Member of IT Strategy Headquarters at Cabinet Secretariat of Japan.

Professor Murai is currently tackling Open Government in Japan, he is the advisor of the Japanese government's "Open Data Promotion Consortium [ja]".

東日本大震災ビッグデータワークショップ

You can see Professor Murai's comment video here, audio is in Japanese, you can turn on English subtitle, and machine translation on other languages:


"This was an awesome project. The point is, how can we leverage this learning to the future." says Prof. Murai. "As you heard during Mr. Suzuki's comments, and as was mentioned in many of the presentations, I'd like to stress what we're doing here can save lives on the grounds in the future. It is important to think about how we link the people on the grounds and the information that was analyzed here."

"The presentations were great- lots of diversity, and this whole day was a great experience for me. I would like to thank and express my respect to the organizers for making this happen, all the data providers that released such data, and participants who did the analysis of those data. What we need to do now, is to connect this with the people on the grounds."

"What we learned today is that the role of public sectors, private sectors and individuals surrounding data is important. Individuals have shown great strength after the disaster, both good and bad. In today's workshop it was all about how to prepare for future disasters, but in a broader terms, how can we build a new global society where the public sectors, private sectors and individuals interacts surrounding data. We experienced a lot of experience on that during the disaster, and we were able to have a precious experience of analyzing and sharing that today. We recognized the importance of properly understanding the data and analyzing data, and then we need to move from theory to action."

"The data used today had time-limited conditions and it's been made available to you because you're academics. Personal info has been made available because of its potential to save lives. Otherwise you won't be able to keep using it. I think the most important thing is to work on making a society in which data is more available. There were many parties who were hesitant about releasing data and didn't provide them. There's a lot of data that we really could have utilized. We need to make an environment where we can use data properly. A society where those who have data can provide it without hesitation. We need to create a system, environment and society that allows to do this.  If we can realize such society, people like you can continue and further develop your present research and connect it to concrete actions that will save human lives. All that depends on how data would be available to the public and private sectors and the individual. If we can realize that, we can make this country a new, data-driven advanced nation. Japan learned a lot from last year's disaster, and with such experience we can make contributions to the whole world. We should take action toward creating such an environment. To make productive use of all this work and research you did today, I want to help create a society where data can be used effectively and safely. What you all have done here today is extremely useful evidence of how people can utilize such open data. I would like to ask all of you here to help. It was a wonderful event today. Thank you everyone."


Disclaimer: The opinions expressed here are my own, and do not reflect those of my employer. -Fumi Yamazaki

Project311- Comments from Mr. Suzuki from Kesennuma

One of the commentators for Project311 workshop was Mr. Hidemitsu Suzuki from Kesennuma City. He was working at city of Kesennuma Crisis Management division, so when the earthquake happened  he was in charge of coping with it. I visited Kesennuma last year and wrote a post about it here. You can see the video of Kesennuma right after the crisis here. The city was hit by earthquake, tsunami and was caught on fire.


You are able to watch his comments in English with the subtitle on this video.


After hearing all the presentations, he shows a video clip of tsunami attacking his city. He says he was impressed by the analysis, he thinks it is helpful to cope with future disasters.

While coping with the crisis, he felt the importance of information provided by government agencies, but in reality the government lacked people who can work on it. At the workshop, he felt encouraged by hearing people talk about the possibility of citizens to help the government publish data.

In Kesennuma, the power outage took two months to fix. It took three months to fully restore the water supply. Missing persons were announced with paper notices in the city hall lobby. That is reality. It wasn't digital.

Traffic jam happened, and the roads were stuck in all directions. Not only were people trying to escape to hills, some were trying to get back to the dangerous city worrying about their families. (According to the survey by the Ministry Internal Affairs and Communications, 27% of the people who got on the cars replied they got on the car in hope to rescue their families.) People were trying to move in all directions and the roads were stuck everywhere. If these people were able to get the information about their families' safety, maybe they wouldn't have gotten back to the city.

There were power outages. Maybe, researches presented in the workshop may not function with power outages. We should be prepared for that, too.

How should people respond to a tweet that simply reads "Help me"? Should you go look for that person?

Here is an example. The central public hall of Kesennuma was hit by tsunami, and citizens who evacuated there were surrounded by fire. There was a mother getting ready to suffocate her own child so that the child wouldn't burn to death. Fortunately they were rescued, thanks to the power of social media. The principal of a kindergarten sent an email via her mobile phone to her son in London. "I'm in the public hall, surrounded by fire. I may not make it, but I will do my best." He asked to spread that information on Twitter and Tokyo's vice governor Naoki Inose saw it. The next day, Inose sent helicopters and rescue units from Tokyo's fire department and rescued them.  This example demonstrated the potential of social media during disaster.

Mr. Suzuki closed his comments hoping that the researchers here will be "intellectuals with wilderness who is able to cope with issues even with power outages".

東日本大震災ビッグデータワークショップ

=====

Let me add some more details about the example described above. It is actually called "the miracle of Kesennuma".

Naoko Utsumi, principal of a school for disabled children was surrounded by tsunami water and fire. She writes an email to her son, Naohito, who live in London: "I'm in the public hall, surrounded by fire. I may not make it, but I will do my best." Her mobile phone was almost out of battery.


Naohito tried to call the fire department but the call didn't get through, so he tweeted:
Please retweet: My mother is the principal of a school for disabled children and she is left on the 3rd floor of the central public hall of Kesennuma City, Miyagi prefecture with dozens of children. The surroundings and the lower floor of the building is drained in water due to tsunami and there is no way to get close to them from the ground. If there is any way to get close to them from the sky, please help at least the children there."
Information spread, and Shuichi Suzuki who lives in Tokyo tweeted it to Naoki Inose, vice governor of Tokyo. He of course did not know Inose in person.


Inose replied "I printed this out and gave it to the executives of Tokyo Disaster Control Center."


The fire department in Kesennuma itself was hit by the disaster and there was no request from the local fire department asking for help. "There never was a case like this, but I want you to go" told Inose, to the manager of Disaster Center. "During the crisis, it is important to clear up the flow of information, to connect the information between the people on the grounds and the people who needs those information. In a critical situation, leaders should tell the team that they will take responsibility and push people to take action." says Inose.

The next morning helicopter arrived in to the city hall. "Great news! The children are saved!" tweeted Inose.


Due to a single tweet from London, the lives of 446 people were saved- including an elderly over 90 years old, newly born baby and an expecting mother (in 10 days), and many children.

Why did this happen? There were lots of tweets, Twitter was flood of information, and Inose gets lots of replies- why was he able to distinguish this tweet? There were lots of false tweets like this. Why did this tweet get in to Inose's eyes, why did he trust it and why was he able to act upon it?

The point, according to Inose was that the tweet was very logical, calm and trustworthy. It had details, it had 5W1H, the sentence was structured well which made him believe that it was true.

In fact, "It took me 1 hour to write that 140 characters. One single sentence can become facts or lies" recalls Naohito.


It is also important to use tools in everyday life, since you just can't suddenly start using tools you're not used to when disaster hits. "I think they sent me this tweet because they knew I was using Twitter regularly" says Inose. If he wasn't using it regularly, there is no way people can expect Inose would take action based on a Tweet.

The other important thing is to write trustworthy posts regularly. When determining whether a tweet is true or false, people will read other tweets by that person, to determine the trustworthiness. Social media is not just about single post- it is accumulation of your posts, trustworthiness and behaviour.


Several articles on miracle in Kesennuma.
NHK Report: "Information lifeline that saved people's lives" [ja]
NikkeiBP: "Miracle in Kesennuma, information source was from London" [ja]
"What you should prioritize during crisis" [ja]
Naoki Inose Blog: "Kesennuma City Hall Twitter rescue- principal of the school visits" [ja]
"Interview with Naoki Inose about the miracle in Kesennuma" [ja]
Video of the interview [ja]

Disclaimer: The opinions expressed here are my own, and do not reflect those of my employer. -Fumi Yamazaki

2013/02/16

Project311- About the Data

When the Great East Japan Earthquake with Magnitude 9.0 struck Japan on 3/11 2011, an enormous amount of information was dispersed through social networking sites and the mass media. While much of it was accurate, there were also many falsehoods and rumors, emphasizing just how important information can be.  How was misleading information conveyed, exactly? And what were the causes behind these mixups?

It was impossible to do such data verification during and right after the earthquake, with all the chaotic situation. But almost 2 years have passed, and it is time to review the data from the time of the disaster and digest the learning from it, and figure out what we can do to prepare for the next disaster. If we don't do it now, we will start forgetting about what happened.

That is why we - Google and Twitter - hosted "The Great East Japan Earthquake Big Data Workshop: Project 311" back in 9/12-10/28 2012. We provided participants data that was produced during the week following the earthquake. They reexamined the data, discussed what can be done to prepare for future disasters, and apply it to service brainstorming.

====Data that was provided for the workshop====

Asahi Shimbun newspaper articles from the week after March 11 (source: The Asahi Shimbun Company)
Google Insights for Search (source: Google Japan Inc.)
Text summary of television broadcasts made just after the Great East Japan Earthquake (source: JCC Corp.)
Tweets from the week after March 11 (source: Twitter Japan K.K.)
Transcripts of the audio broadcasted by NHK-G in the 24 hours following the disaster and a ranking of frequently used words (source: Japan Broadcasting Corporation, NHK)
Honda Internavi traveled roads data (source: Honda Motor Company, Ltd.)
Rescuenow's railroad operation information and various disaster-related information (source: Rescuenow. Inc.)
Traffic congestion statistics (source: ZENRIN DataCom Co., Ltd.)
Short link data of bit.ly (source: Bitly Inc)
Citizens' report on damages from earthquake and tsunami, lifeline information (source: Weather News)
Information on earthquake and tsunami prediction, data from AMEDAS (source: Japan Weather Association)

A bit more info about some of those data:

Honda's Internavi roads data is based on the data they had from car navigations, which was extremely useful when aggregated as a drivable map, since many of the roads were damaged by tsunami, and was not drivable. You can still see it at Google's Crisis Response page.


Some videos to understand more about Honda's data.


Zenrin DataCom's traffic congestion statistics data comes from mobile phones. This data is extremely useful when aggregated to understand where people were and their moves. In the following video you can see data from Tokyo on 3/11/2011. People are moving quickly commuting in the morning, the city of Tokyo getting really congested, and the motions suddenly slows down on and after 14:45 when the earthquake happened, since many of the public transportation stopped. They slowly move out of Tokyo, and the speed accelerates towards the night as the public transportation recovers.


====Results====

-600+ teams registered and signed TOS. They were mixture of researchers, developers, journalists, professors and students, NPOs, etc
-Massive collaboration among people who'd never met, from different universities, different companies,   etc
-50 teams presented their research results at the report event (more teams wanted to present, but event time was limited)
-Report event summary of all the abstracts, slides, and video
   Part1: Information in the devastated area [ja] (8 presentations)
   Part2: Crisis information on Twitter [ja] (5 presentations)
   Part3: Understanding what happened during the crisis [ja] (12 presentations)
   Part4: Chaos in areas around Tokyo [ja] (6 presentations)
   Part5: The role of mass media during crisis [ja] (6 presentations)
   Part6: What should the citizens tell others, to whom and how [ja] (6 presentations)
   Part7: Information circulation via Twitter [ja] (7 presentations)
   Poster sessions [ja] (15 presentations)
   Comments from the commentators and data providers [ja]

Further postings planned for individual project report:
-Comments from Mr. Suzuki from Kesennuma
-Comments from Professor Murai
-Project Hayano, analysis of Iodine emitted from Fukushima nuclear power plant
-Visualization of the Evacuation Process During the Tsunami

====What worked and what didn't====

-Open Data

Many of the data provided for this workshop was not available till the workshop. It was a good opportunity not only for the participants, but also for the data providers as well, to reconsider their policy, and prepare what they can do with their data in the future. They learned the value of opening their data and having the citizens use that data for more valuable findings. Some companies are already getting ready for their actions. True, we would've loved to have more data providers- but I did hear comment from a participant that "companies that can't provide data for workshops won't be able to provide data during crisis anyways."

-1.5 months analysis period
We announced the event on 9/12, had office hour on 9/19 where all the participants can come to Google Japan office, and all the data providers will answer all of their questions. We held mid-term report event on 10/13 and final report event on 10/28. There were many discussions about this schedule. Some say it was too short for deep analysis. Some say it was good that it was short, they were able to concentrate and come up with results in short period of time. During the next crisis, we won't be able to analyze for 1.5 months, we need to move quickly to provide valuable analysis, so I think we did the right thing. I may be wrong.

-5 minute presentation time
The format was 5 minute presentation and 2 minute QA/comments, with the exception of top 5 teams that were voted to speak 2 minutes extra. At the mid-term report event, I was unable to stop some people going over time- the presentations were extremely interesting and was hard to stop them, but I did get some complaints in terms of fairness. At the final report event, we used a gong and stopped everyone however interesting they are. The event went smoothly on schedule. Although 5 minutes were very short, the presentations became crispy and did not get bored even after listening to 50 presentations in one day so I think it was good.

-Final slide rule
After the mid-term report event, one of the participants- Professor Ryugo Hayano told me we should fix the format. People were just reporting what they learned from the analysis, which is not enough. Therefore, for the final report event, we made a rule for the presenters to finish the last slide with visions on how their analysis will benefit the victims from Tohoku disaster, or future disasters. Some actionable proposals came out from their last slides.

-More collaboration
Communication tools among the participants were the offline events, mailing list, Twitter, Google+ etc and some people leveraged from that, some didn't. An example of a good collaboration was "geolocation info tweet list project". Twitter data was just a list of tweets with geo-id and tweet-id, and each participant had to use Twitter API to get the location information. So one of the projects that came up was making a JSON format dataset of tweets with geolocation data. Some people announced to start working on it so that it will be valuable for others to use, and many who thought it is valuable started helping out. They have never met each other, but started collaborating online. "Twitter data cleaning project" was another one- data that was provided by Twitter had line breaks and was difficult to use. Therefore, some of the participants started a project to clean the data and provide a script in a matter of hours or couple of days- some wrote a Python script some with Ruby, some wrote a script to extract posts with specific words, some made a tool to put into charts. This thread started with "Houston, I have a problem with Twitter data. I think this is applicable to all of you" and others just jumped in to help and was able to avoid duplicate works in the very early stage and fixing the issue - so I think it worked more on the tools side. The problem was analysis side- since many teams were working on rumor analysis from Twitter data, it was hard for them to throw away their own analysis and join other groups which were doing similar analysis. So we had some duplicate efforts there, which could have been solved by more collaboration.

====Comments====

I really think it is important that we remember and reflect and learn from the past experiences so that we don't make the same mistake again. Also, it is important to share what we learned. That is exactly why I'm writing this post.

It is easy for the governments and data owners to resist opening the data- they have a bunch of reasons not to. Maybe citizens will not use the data even if they make it open (after a lot of efforts). Maybe some bad things happen. This project is antithesis to that. People WILL come and use the data and come up with valuable analysis if we open the data. I am glad we were able to prove that.

I think it is easy for the analysts, researchers and developers to just complain that the data is not open, it doesn't exists, the format is bad, etc. This project is antithesis to that as well. The dataset was not complete- it had some restrictions. We didn't have some data that we would've wanted to have. But there will never be a single day that EVERYTHING is open. It shouldn't be- some data should be open, some should be closed, like personal data. Complaining is easy- but I believe if we can show the value of opening the data and making use of it, more governments, more companies, more entities will start opening their data. I think Project311 was evidence of such move.

Also, the data was too big for some people to handle- their tools didn't work. But there will never be a single day that a perfect tool will be ready for you- we'll just need to collaborate and work around and tackle the data.

Oh and by the way, it doesn't even have to be "big data". It should be "valuable data", but rubbish data for some people may be valuable to others, so don't discount that. "Open data in a standardized format". No PDF, please.

Lastly, open data is not just about crisis. The Japanese government, companies and the society needs to get used to opening various data all the time. Also, "opening data" does not merely mean making data available- it includes the responsibility of the citizens, researchers, developers etc to make use of those data, so information literacy and data literacy is a big issue here.

====Photos from the workshop====

Professor Jun Murai from Keio University (left), the father of Internet in Japan, and Mr. Hidemitsu Suzuki (middle), who was in charge of coping with the disaster in the city of Kesennuma Crisis Management division stayed the full 9 hours of the presentations and commented on each and every 50 presentations that took place. In fact, they were still discussing about the presentations during the breaks. On the right is Professor Fumihiko Imamura from Tsunami Engineering Laboratory Disaster Control Research Center or Tohoku University.

東日本大震災ビッグデータワークショップ

University of Tokyo kindly offered to provide us their classroom for the presentation.

東日本大震災ビッグデータワークショップ

We livestreamed the presentations on Hangout On Air so that those who could not come to the venue can watch. We also had NPO in Sendai working on crisis response and local city government official from Ishinomaki city join the hangout to provide comments to the presentations. I think it is important to involve people on the grounds on those researches, so that we are not doing those activities for self satisfaction- but to work on something that is actually useful for those in need, via direct discussion.

I have seen too many projects after the earthquake that are self satisfactory for engineers in Tokyo that is not useful on the grounds. It hurts to hear those honest opinion, but we need to listen to those voices and refocus on what is actually useful, than using valuable resources on projects that are not going to be used.

東日本大震災ビッグデータワークショップ

The walls of the room were used for poster sessions.

東日本大震災ビッグデータワークショップ

東日本大震災ビッグデータワークショップ


This is not the end- in fact, it is just the beginning. We should do more.

====Videos with English Subtitles====

Comments from Mr. Suzuki from Kesennuma
Comments from Prof. Murai from Keio University
Comments from Mr. Ishii from JCC (data provider) "Transcription and Distribution of TV Coverage" Aiming for Prompt Establishment of Disaster Mode

Visualization of the Evacuation Process During the Tsunami
Visualizing March 11th in graphs
Project HAYANO
NHK Project "3 Maps for the Evolution of Disaster Information Transmission"
Shibuya project : Crowd management in urban disaster by real-time Information analysis.
Population Dynamics in the Tokyo Metropolitan Region after the Earthquake
Production of Mashup Content Displaying the Spatial and Temporal Relationship of Scattered Data, Based on Web Activity
An Examination of Disaster Information Dissemination Based on a Semantic Analysis of Twitter Data
Development of a Tool for Filtering Information from Text Data After and Earthquake
Auto-Extracting Routes from Twitter in a Disaster and Verifying Their Credibility
Use of Hashtags During Times of Disaster
Information Filtering Based on Region and Time
Information that was Needed and Information that Circulated in Sendai
An Attempt to Review the State of Regional Information Transmission in Tsukuba
NICT Disaster Response Q&A System
Providing Multilingual Information During Disaster
Disaster and Medical Information
Estimating the Extent of Disasters Based on the Detection of Gaps in Data Transmission
An Analysis of Tendencies in Postings of Corrective Information
Is There a Connection between the Mass Media and the Spread of Information on Twitter?
Voluntary Evacuation: Dynamics, Problems and Solutions
Modeling the Behavior of Tokyo Area Commuters
Getting a Sequential Picture of Damage Inflicted Based on Tweets with GPS Data
Implications of Disaster Data
An Analysis of Road and Traffic Information
A Study on Information Demand and the Mass Media During Earthquake
Providing Information to Disaster Victims with Special Needs During Major Disasters
Toward Information Triage in Times of Disaster- Using Twitter Trend Analysis
Comparing Ordinary and Post-Earthquake Population Distributions

Disclaimer: The opinions expressed here are my own, and do not reflect those of my employer. -Fumi Yamazaki